
No longer do we have to make decisions online like those offline—relying on faith and intuition. As Avinash Kaushik aptly argues,
"We live in the most data-rich environment on the planet—an environment where numbers, math, and analysis should be the foundation of our decisions. We can use data to determine how to market effectively, how to truly connect with our audience, how to improve our return on investment…”
When done right, A/B testing (also referred to as split or multivariate testing) is a powerfully efficacious, data-informed technique specifically used to gain insight into user behavior in order to increase your bottom-line.
Just as it sounds, A/B testing involves comparing two versions (A is usually the control version, and B a slightly newer version) of an element (in this case, we'll be focusing on ad copy but split testing can be used for optimizing emails, landing pages, and etcetera). This is done by splitting website traffic between the two versions, and simultaneously measuring their performance based on metrics that define success (i.e. click-through-rate, conversion rate, and return on investment).
If the newer version proves more successful, it will replace the original and if the original preforms better, the newer version will be phased out. It’s not a quondam method, but rather, elements should be tested regularly, since optimization is an ongoing process and the effectiveness of anything can change over time.
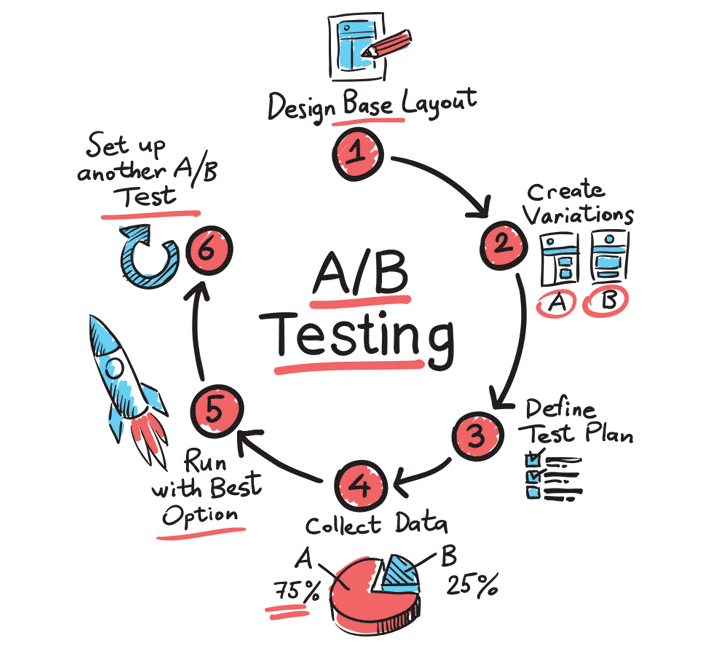
By using this controlled testing technique and gathering empirical data, you are able to identify and statistically validate seemingly subjective questions of ad design (image, headline, text inside ad, call to action, etcetera)—transforming guesswork into data-driven social science.
Once you see how a minute change in ad copy can significantly impact the success of an online promotion, the idea of not conducting regular and rigorous A/B testing is just downright foolish. So why is A/B testing significantly underutilized by many online marketing professionals? Well, quite simply the technique is not as painless as it sounds. For starters, it takes technological know-how to divert user traffic and segment users, a thorough understanding of how to organize and perform dependable tests, and sound knowledge of statistics to make sense of the results.
While this article won’t build your technology or teach you statistics, it will provide you with a foundational understanding of some of the major complexities that underlie A/B testing ad copy on the GDN, as well as reveal some of our proprietary solutions for mitigating these complexities.
Multiple variables & incremental testing—makes organization difficult but imperative
It is paramount that you keep tests organized, however, it’s not as easy as it sounds. For one, effective testing requires testing one variable of an ad at a time, side by side—allowing for only incremental changes.
Let’s consider the obvious variables of an image text ad for example:

Now, say you decide to change both the headline and call to action (CTA). You test the newer version against the original and the click-through-rate (CTR) jumps significantly. The problem here is that you don’t know whether the ad is performing better because of the new headline, the new CTA, or a combination of both. And it’s knowing how well specific variables perform that is imperative. After all, the whole point of A/B testing is to eliminate guesswork from the equation. So in order to achieve that, you can only test one variable at a time.
There are other variables, beyond the obvious, that need to be taken into consideration. First off, you have to take into account the fact that users are seeing ads on different devices. For example, ads seen on desktop are more feature-rich and have a stronger visual impact than those seen on mobile devices.

So, device is yet another variable that needs to be factored in. Similarly, ads may be targeted (interest, topic, placement) differently. Let’s look at this control ad for example:

This ad is in an ad group targeting sports sites. Now say we want to test an alternative headline:

However, this time the ad is in an ad group targeting sites related to nutrition. Even if the newer version beats the previous version, those results are inconclusive. The increase in performance could just be that the targeting was more relevant to the ad and could have nothing to do with the copy changes.
Again, our goal is to eliminate these questions and in order to do this we need to methodically test ads side by side with only one variable difference. The difficulty in such incremental testing and multivariable optimization is conjuring up a methodized way of organizing ad variations to test. Our solutions to this are coming up soon but first let's touch on another major challenge...
Testing time frames and knowing when to kill ads

Not only do you have to test individual variable changes incrementally, but you also need consistency with testing time frames.
For example, say we decide to test ad variations from March 1 until March 10 but on March 7 we decide to add a new variation for testing. Obviously, we will not have accurate results for the newest version. Hence, in order to get dependable results, it is crucial that ads are uploaded at the same time and run consecutively.
A related difficulty is knowing how long to test for and when to kill underperforming ads. If you run a test for too long, you might miss the opportunity to implement changes. Likewise, if your test is too short then your results can be inconclusive. The best way to ensure that you reach a time frame in which you can make data-informed decisions is by collecting enough data to gain statistical significance.
Results are considered statistically significant when it is unlikely they occurred by chance. There are different levels of statistical significance: 80%, 95%, 99%, and 99.9%—though most set the confidence level at 95%, signifying that there is a 5% chance that the test results are a coincidence.
There are statistical significance calculators available online (i.e. statistical significance tool and free A/B testing calculator), which compute the absolute difference between two ads’ CTR and CVR. However, they’re not as helpful as they may seem.
According to our PPC Analyst, Neta Winberger,
“These ‘calculators’ don’t indicate which ad should be the control and they are only useful if you know for a fact that the variations being compared have sufficient stats.”
So, how do we mitigate these difficulties?
As previously mentioned, organization is key. First off, we organize our tests by campaign < ad groups < ad variations:
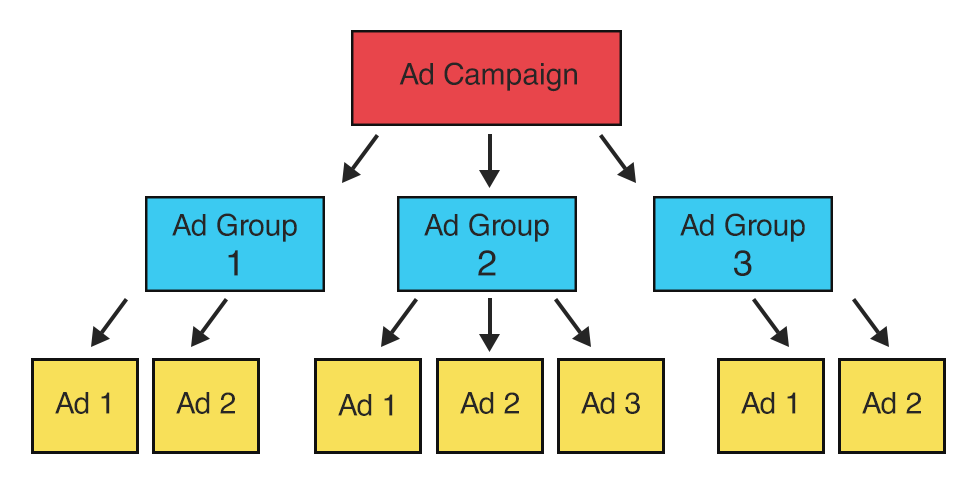
Each campaign includes the same visitor device type. That is, we separate desktop from mobile at the campaign level—ensuring devises are the same, while other variables are tested.
Each ad group within a campaign already has the same targeting—also ensuring that targeting is the same across the board while other variables are tested.
Finally, ad variations are organized within an ad group. Now, in order to be able to efficiently inspect variables of an ad, our COO, Joel Bondorowsky, came up with an ad naming structure.
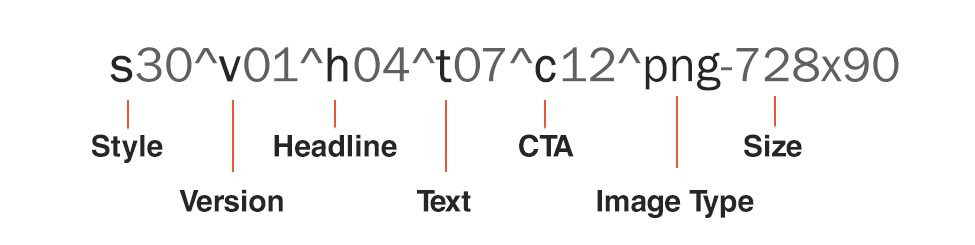
As you can see, the naming structure includes the constituents of the ad itself. This helps us to identify, manually or by algorithm, ads that are running side by side and ensure only one variable difference between tests.
By organizing our ads accordingly, our developers were able to create technology that not only identifies ad variations that were tested within an ad group side by side under a particular campaign but also, aggregate results across campaigns to give us even more precise results. The analysis algorithm behind our technology not only automatically identifies and aggregates results but also produces a final report.
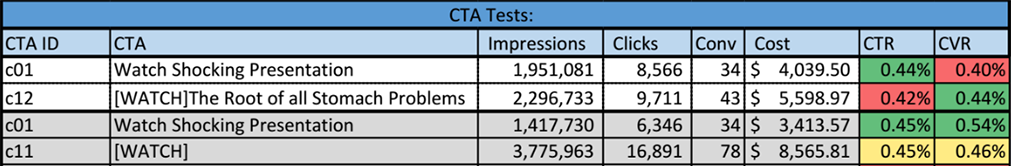
As shown above, the final report shows each test and lists the impressions, clicks, converted clicks, spend, conversion value, CTR, CVR, and ROI for each version. It further color codes winning versions.
In addition, we also developed an algorithm that determines statistical significance for us. In all, our technology not only removes the legwork in reporting but also helps us determine when to kill ad variations.
Where we hope to take it…
Our developers are in the final stages of creating what we call, the automatic killing machine. The idea is to make the A/B testing process almost entirely automated, not only reporting on tests but also killing the worst ads from each ad group when sufficient stats are available.
A/B testing should be the governing ethos of any successful digital performance marketing strategy and we’re hoping to develop more ways to efficiently test, optimize, and improve performance.
 Twitter
 Facebook
 LinkedIn